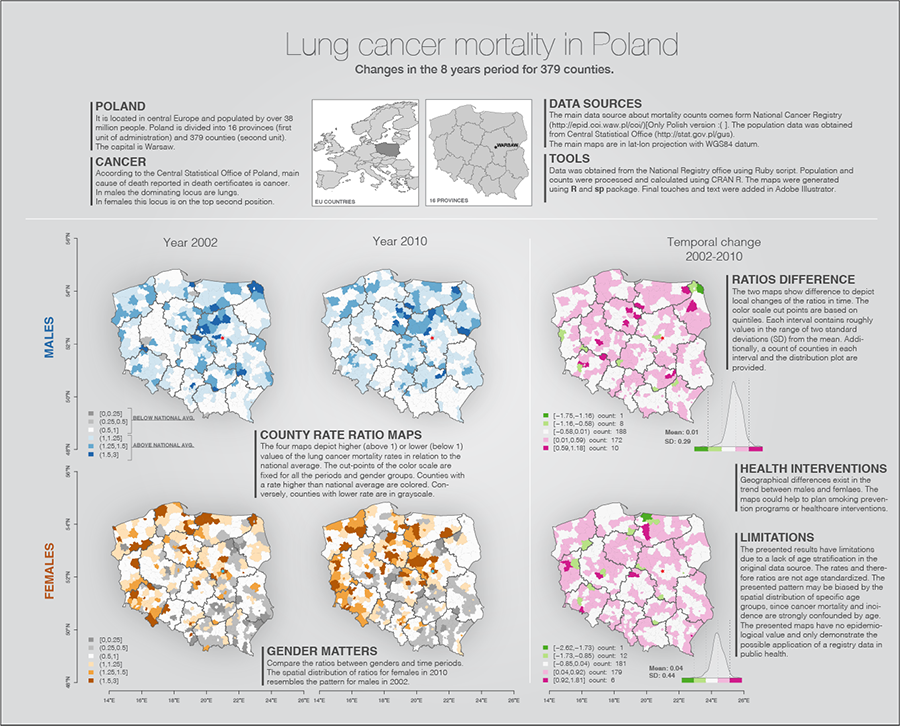
This is a sample of map design. Based on the Polish National Cancer Registry data. It represents risk distribution of lung cancer in polish counties. The choropleth map as well as the data were processed in CRAN R with help of the sp package. The illustration was a final project for my Coursera Geospatial Revolution class, which I took in summer 2013.